- Home
- About Us
- Solutions
- WareConnect for
Microsoft Dynamics 365 - WareConnect for Xero
- WareConnect for MYOB
- Wareconnect for Databuild
- Digital Automation Suite
- Digital Procurement
- Digital Accounts Payable
- Digital Procurement To Pay
- Digital Timesheet
- Digital Sales Order
- Digital Accounts Receivable
- Digital Statement Matching
- Digital Bank Summary

Business intelligence
like never before
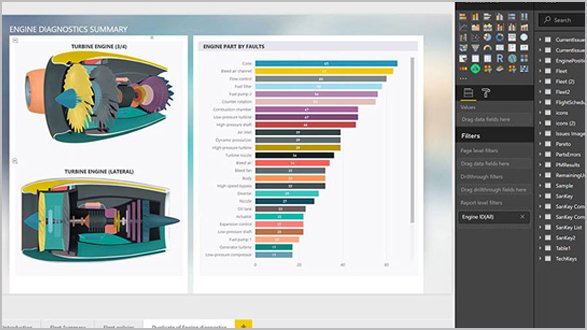
Go from data to insights in minutes. Any data, any way, anywhere. And all in one view.
What is MICROSOFT Power BI


Microsoft Power BI is a business intelligence cloud service that provides non-technical business users tools for aggregating, analyzing, visualizing and sharing data. Power BI's user interface is fairly intuitive for those users familiar with Excel and its deep integration with other Microsoft products makes it a very versatile tool that requires very little upfront training. It aids in understanding business issues and exploring data in meaningful ways.
Power BI is a combination of cloud-based visualization, self-service data analysis tool for data analysis and much more:
- It provides business intelligence like never before.
- Helps to go from data to insights in minutes.
- View any data, anyway, anywhere that too in a single view.
How is MICROSOFT Power BI helpful

Power BI is a suite of business analytics tools that deliver insights throughout the organization. Connect to hundreds of data sources, simplify data prep, and drive ad hoc analysis. Produce beautiful reports and publish them for your organization to consume on the web and across mobile devices. Anyone can create personalized dashboards with a unique, 360-degree view of their business and scale across the enterprise, with governance and security built-in.
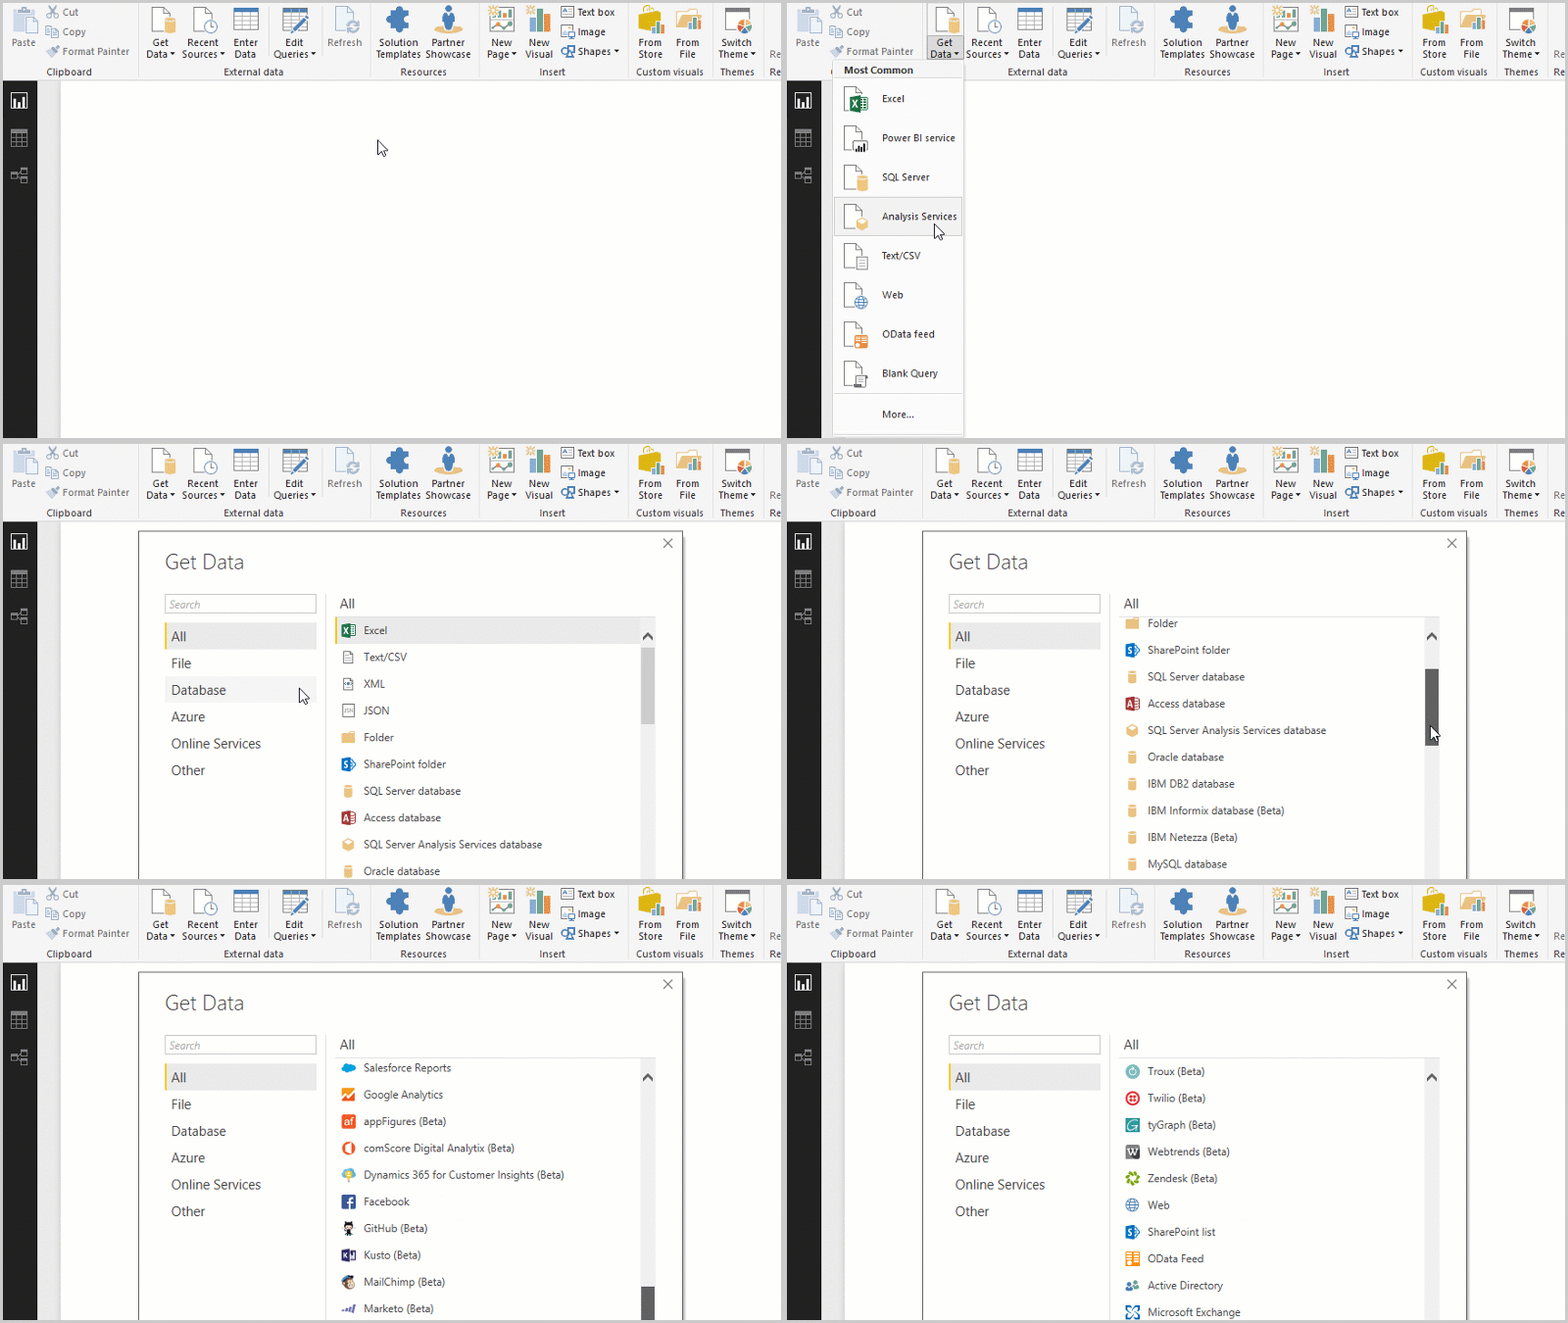
Connect to any data source
Explore your data from anywhere; in the cloud or on-premises—including big data sources such as Hadoop and Spark. With connections to hundreds of types of sources, and the list constantly growing, Power BI lets you draw deep insights for a broad range of scenarios.
List of data sources
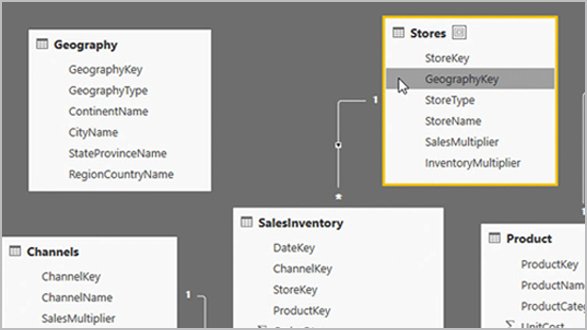
Prep and model data with ease
Data prep can take most of your time. But its super quick with Power BI data modeling. Clean, transform, and mash up data from multiple sources—in just a few clicks.
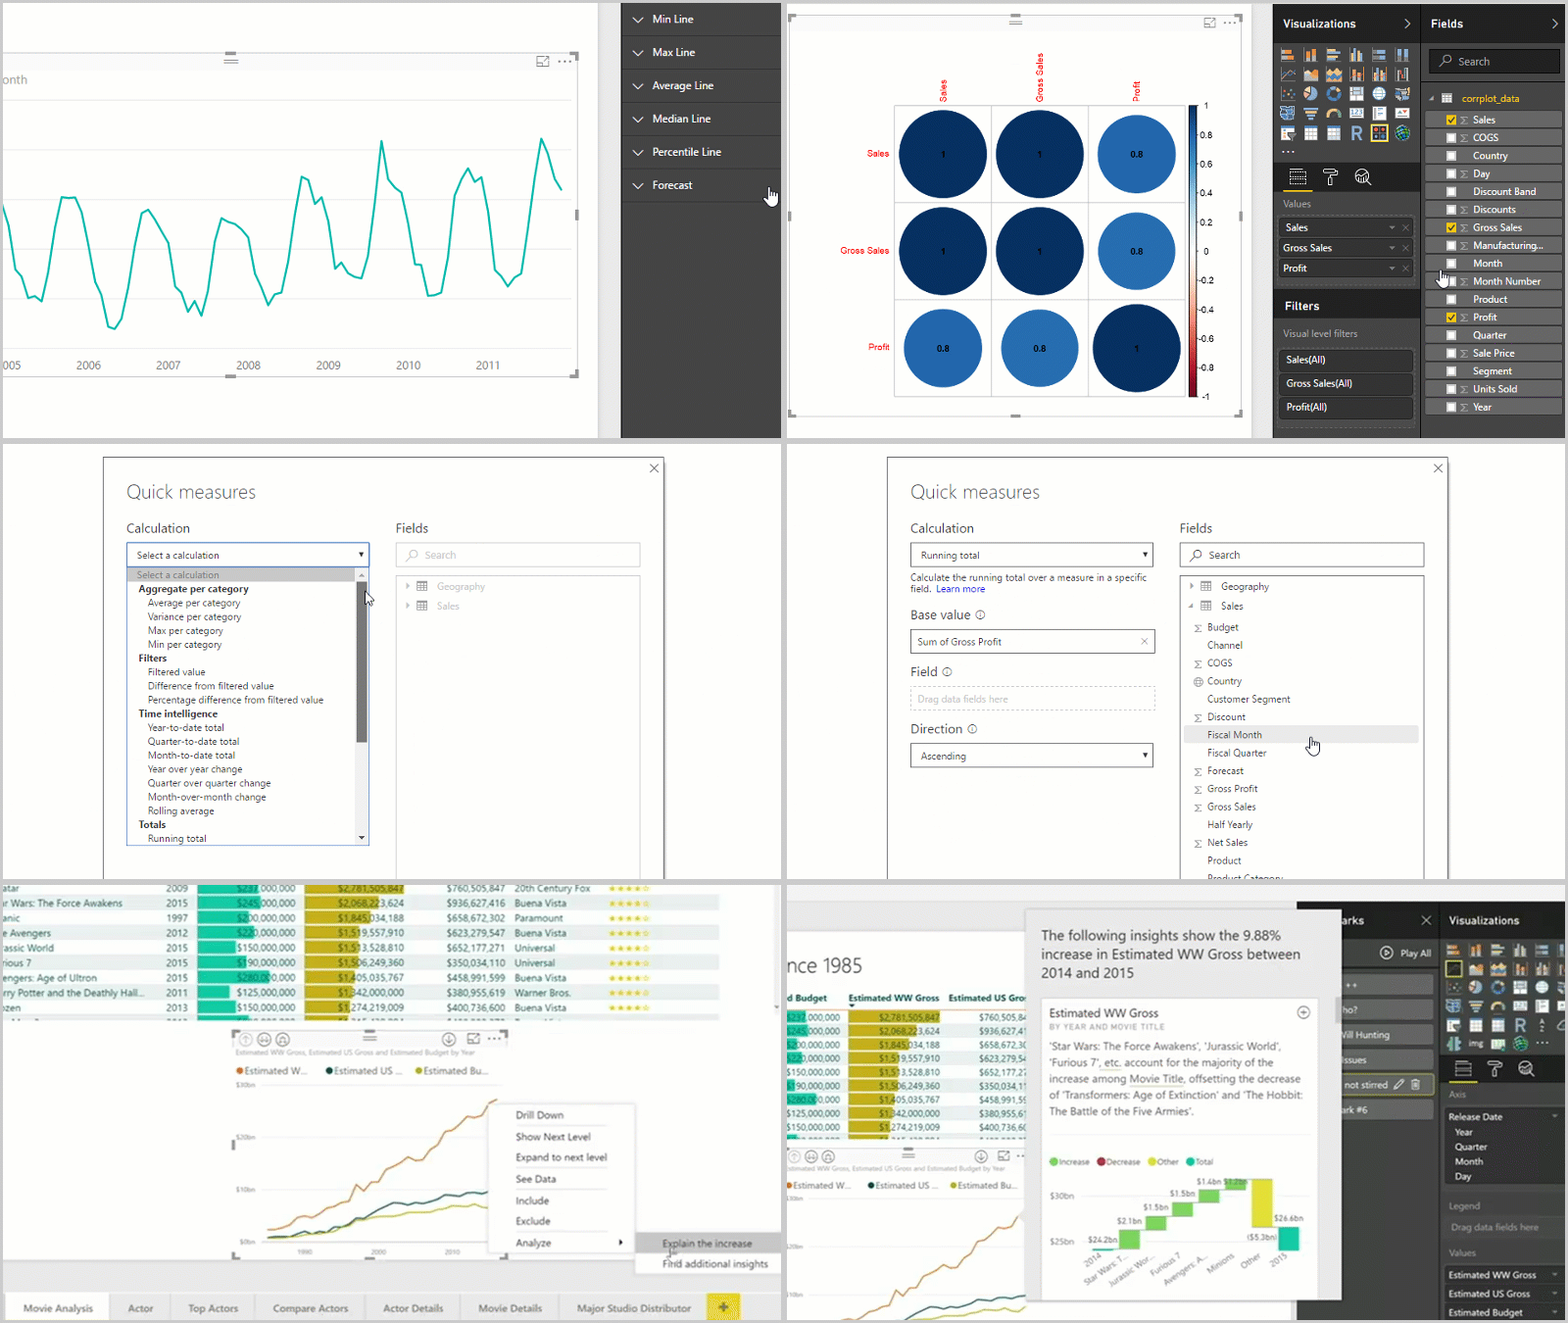
Provide advanced analytics
Enables users to dig deeper into data and find patterns they may have otherwise missed. With Power BI features like quick measures, grouping, forecasting, and clustering provide excellent analytics. Also, advanced users have full control over their model using powerful DAX formula language.
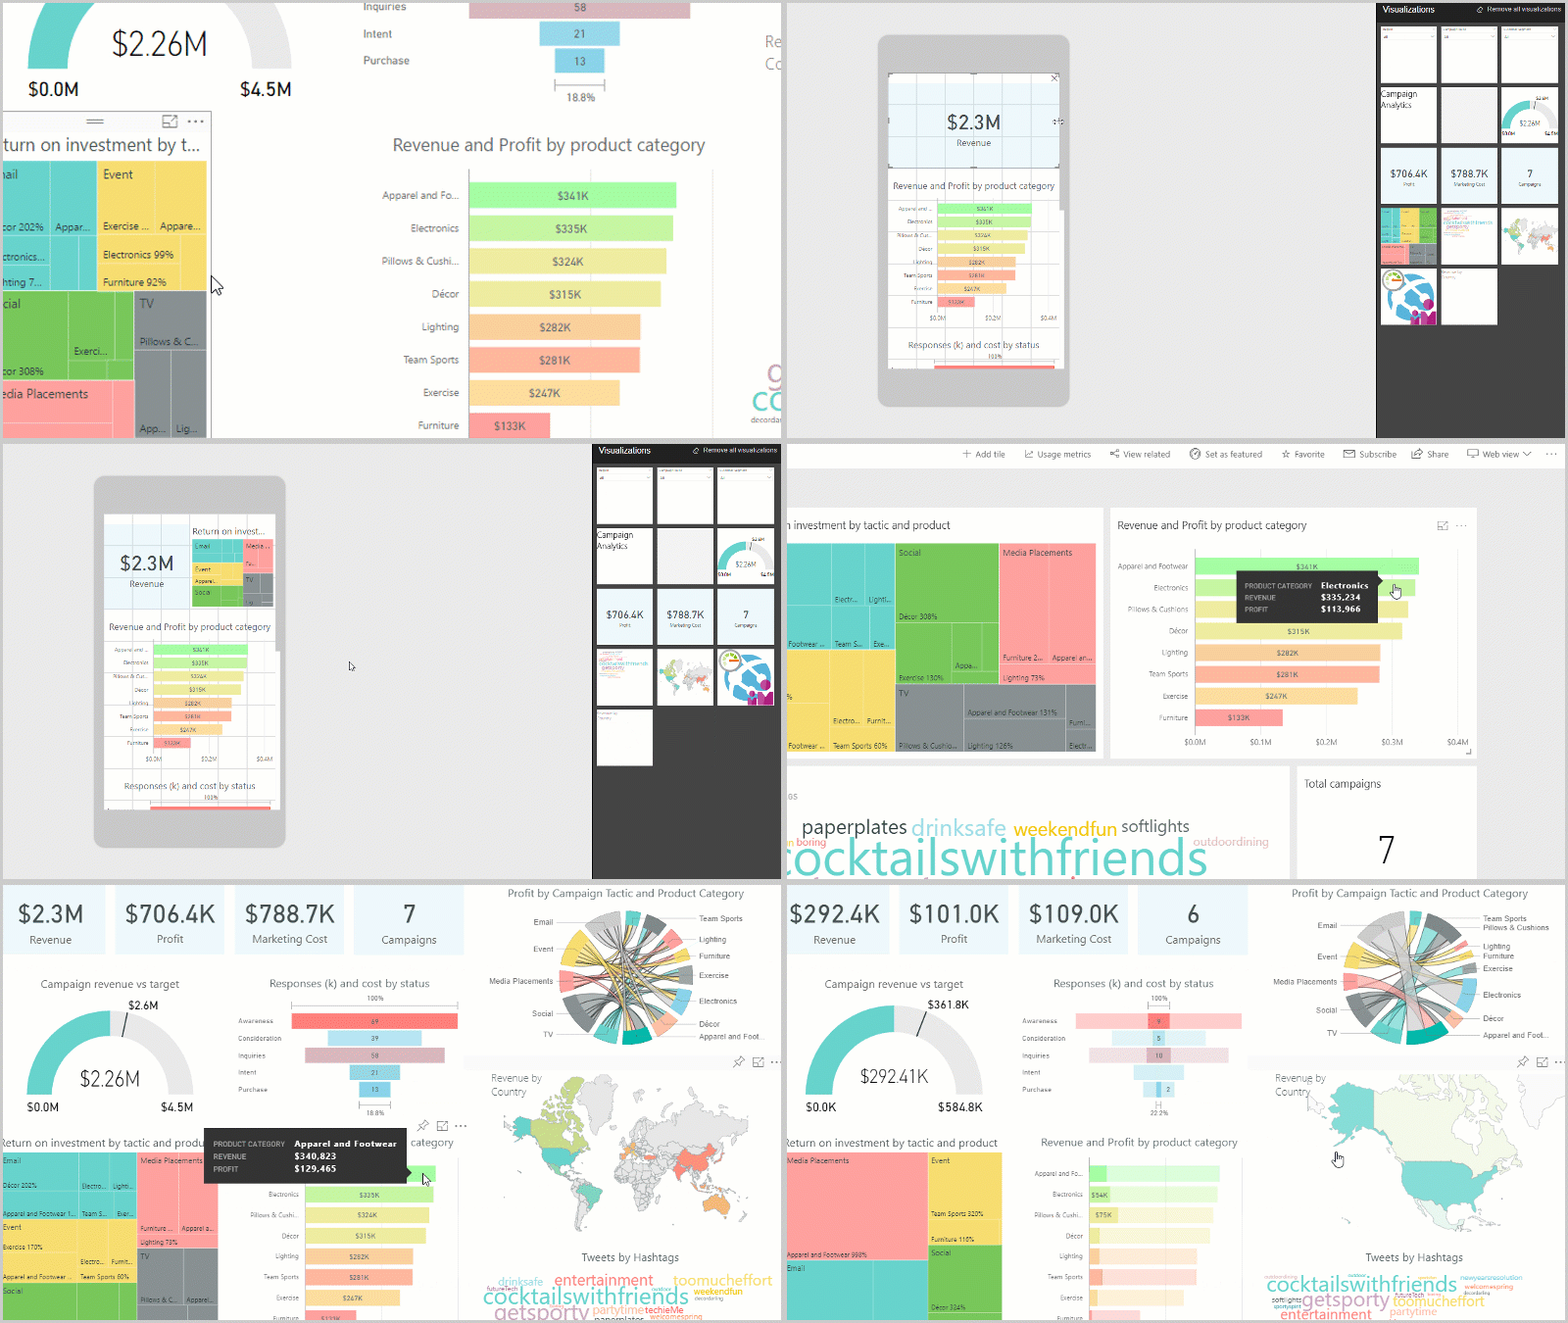
Author for everyone, anywhere
Get visual analytics to the people who need it. Create mobile-optimized reports for viewers to consume on the go. Publish from Power BI to the cloud or on-premises. Embed reports created in Power BI into existing apps or websites.
